What is an Affinity Diagram? When to use an Affinity diagram? The affinity diagram organizes a large number of ideas into their natural relationships. It is the organized output from a brainstorming session. We use it to generate, organize, and consolidate information related to a product, process, complex issue, or problem.
 |
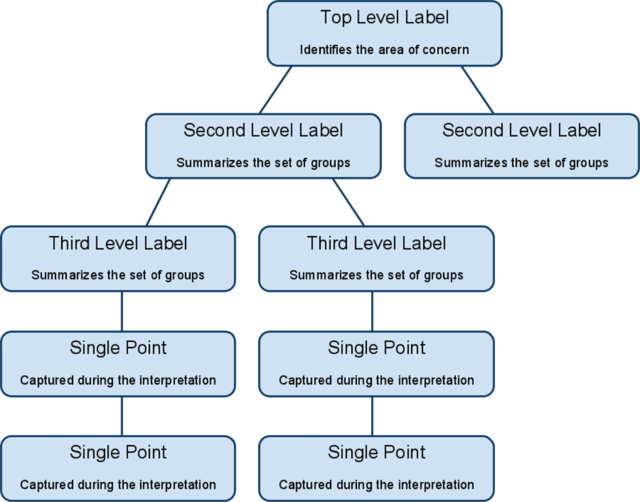
| Image Credit: Wikipedia |
After generating ideas, group them according to their affinity, or similarity. This idea-creation method taps a team’s creativity and intuition.
Who invented an affinity diagram?
An affinity diagram is a business tool used to organize ideas and data. It is one of the Seven Management and Planning Tools. It was invented in the 1960s by Japanese anthropologist Jiro Kawakita.
When to use an affinity diagram?
- When you are confronted with many facts or ideas in apparent chaos
- When issues seem too large and complex to grasp
- When group consensus is necessary
Typical situations are:
- After a brainstorming exercise
- When analyzing verbal data, such as survey results
- When collecting and organizing large data sets
- When developing relationships or themes among ideas
- When reducing attributes to categories that can be addressed at a higher level
What is an Affinity Diagram Process?
The affinity diagram process lets a group move beyond its habitual thinking and preconceived categories. This technique accesses the great knowledge and understanding residing untapped in our intuition. Affinity diagrams tend to have 40 to 60 items; however, it is not unusual to see 100 to 200 items.
Step 1: Record each idea with a marking pen on a separate sticky note or card
(During a brainstorming session, write directly onto sticky notes or cards if you suspect you will be following the brainstorming with an affinity diagram). Randomly spread notes on a large work surface so all notes are visible to everyone. The entire team gathers around the notes and participates in the next steps.
Tips: Use markers so words can be read clearly even from a distance. With regular pens, it is hard to read ideas from any distance. Written ideas should be between three and seven words long.
Step 2: Look for ideas that seem to be related in some way and place them side by side
Attempt to look for relationships between individual ideas and have team members simultaneously sort the ideas (without talking) into five to 10 related groupings. Repeat until all notes are grouped. It’s okay to have “loners” that don’t seem to fit a group. It is also Okays to move a note someone else has already moved. If a note seems to belong to two groups, make a second note.
Tips: It is very important that no one talks during this step. The focus should be on looking for and grouping related ideas. It is also important to call these “groupings.” Do not place the notes in any order or determine categories or headings in advance.
Step 3: Begin a discussion with your team
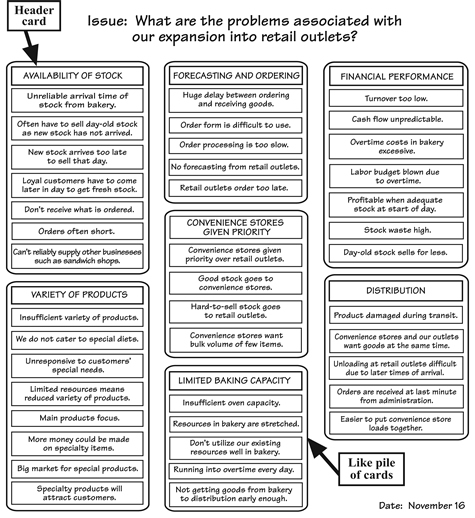
From these relationships, attempt to define categories and create summary or header cards for each grouping or category. You can discuss the shape of the chart, any surprising patterns, and especially reasons for moving controversial notes. Make changes and move ideas around as necessary. When ideas are grouped to the team’s satisfaction, select a heading for each group. To do so, look for a note in each grouping that captures the meaning of the group. Place it at the top of the group. If there is no such note, write one. Often it is useful to write or highlight this note in a different color.
Tips: Header cards should clearly identify the common thread for all groupings and should be descriptive of that thread.
Step 4: Combine groups into "super groups," if appropriate
Assign all ideas to the identified categories by placing ideas under header cards.
What does an affinity diagram look like?
A completed affinity diagram is shown below. In the example, a bakery has recently expanded its business and opened a chain of retail outlets. A number of problems have arisen and the management team, involved with the retail outlets, has met to discuss the problems. The issues are complex so they have decided to complete an affinity diagram.
 |
| Image Credit: PQsystem |


