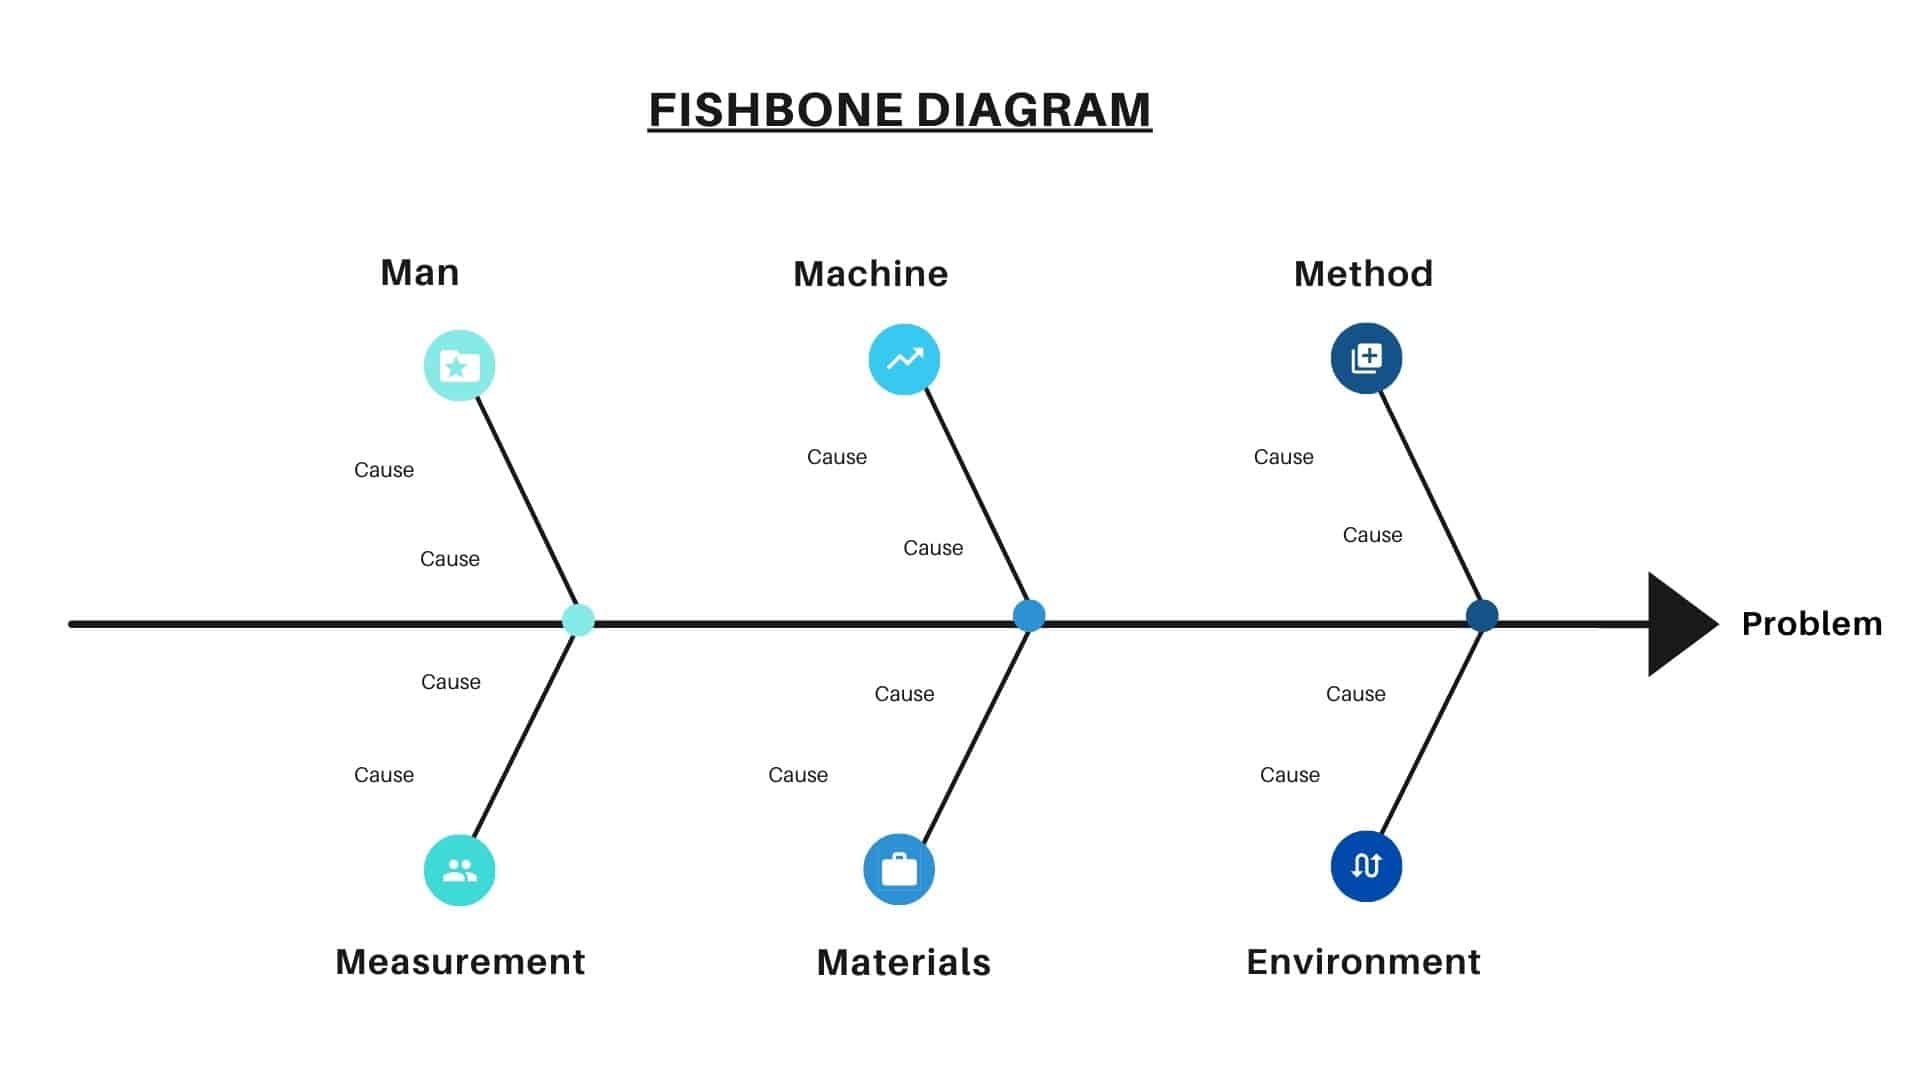
This cause analysis tool is considered one of the seven
basic quality tools. The fishbone diagram identifies many possible causes/ potential causes for
an effect or problem. It can be used to structure a brainstorming session. It
immediately sorts ideas into useful categories.
A fishbone diagram is a visual way to
look at cause and effect. It is a more structured approach than some other
tools available for brainstorming the causes of a problem (e.g., the Five Whys
tool). The problem or effect is displayed at the head or mouth of the fish.
Possible contributing causes are listed on the smaller “bones” under various cause categories. A fishbone diagram can be helpful in identifying possible causes for a problem that might not otherwise be considered by directing the team to look at the categories and think of alternative causes. Include team members who have personal knowledge of the processes and systems involved in the problem or event to be investigated.
Common uses of the Ishikawa diagram are product design and quality defect prevention to identify potential factors causing an overall effect. Each cause or reason for imperfection is a source of variation. Causes are usually grouped into major categories to identify and classify these sources of variation.
What is the Definition of Fishbone Diagram?
A fishbone diagram is a visual way to look at cause and effect. It is a more structured approach than some other tools available for brainstorming the causes of a problem (e.g., the Five Whys tool). The problem or effect is displayed at the head or mouth of the fish.
Who Invented Fishbone Diagram?
Kaoru Ishikawa was a Japanese organizational theorist and a professor in the engineering faculty at the University of Tokyo noted for his quality management innovations. He is considered a key figure in the development of quality initiatives in Japan, particularly the quality circle.
When to use a fishbone diagram?
- When identifying possible/ potential causes for a problem statement/ defect
- When a team’s thinking tends to fall into ruts
How to use a fishbone diagram?
Materials needed for fishbone diagram
Marking pens and flipcharts or
whiteboards.
Process of fishbone diagram:
1. Find out the problem statement (effect). Write it at the center-right of the flipchart or whiteboard. Draw a box around it and draw a horizontal arrow running to it.
2. Brainstorm the major
categories of causes of the problem. If this is difficult use generic headings: i.e. Man, Method, Material, measurement, Machine, environment, etc.
3. Write the categories of
causes as branches from the main arrow.
4. Brainstorm all the possible causes of
the problem. Ask "Why does this happen?" As each idea is given, the
facilitator writes it as a branch from the appropriate category. Causes can be
written in several places if they relate to several categories.
5. Again ask "Why does this happen?" about each cause. Write sub-causes branching off the causes. Continue to ask "Why?" and generate deeper levels of causes. Layers of branches indicate causal relationships.
6. When the group runs out of ideas, focus attention on places on the chart where ideas are few.
What is the advantage of a fishbone diagram?
- Highly visual brainstorming tool which can spark further examples of root causes
- Quickly identify if the root cause is found multiple times in the same or different causal tree
- Allows one to see all causes simultaneously
- Good visualization for presenting issues to stakeholders
What is the disadvantage of a fishbone diagram?
- Complex defects might yield a lot of causes which might become visually cluttering
- Interrelationships between causes are not easily identifiable
The fishbone diagram is a visual representation of cause and effect relationships. It is simple to use the tool yet very effective in improving a process and the quality of a product or service. With its continuous implementation, an organization can be proactive in determining any process shortcoming and address problems quickly and accurately.
The business organization can effectively use this tool to achieve six-sigma results in their processes. It can be drawn on paper, a spreadsheet, any word processing software, or with the assistance of much online software.


